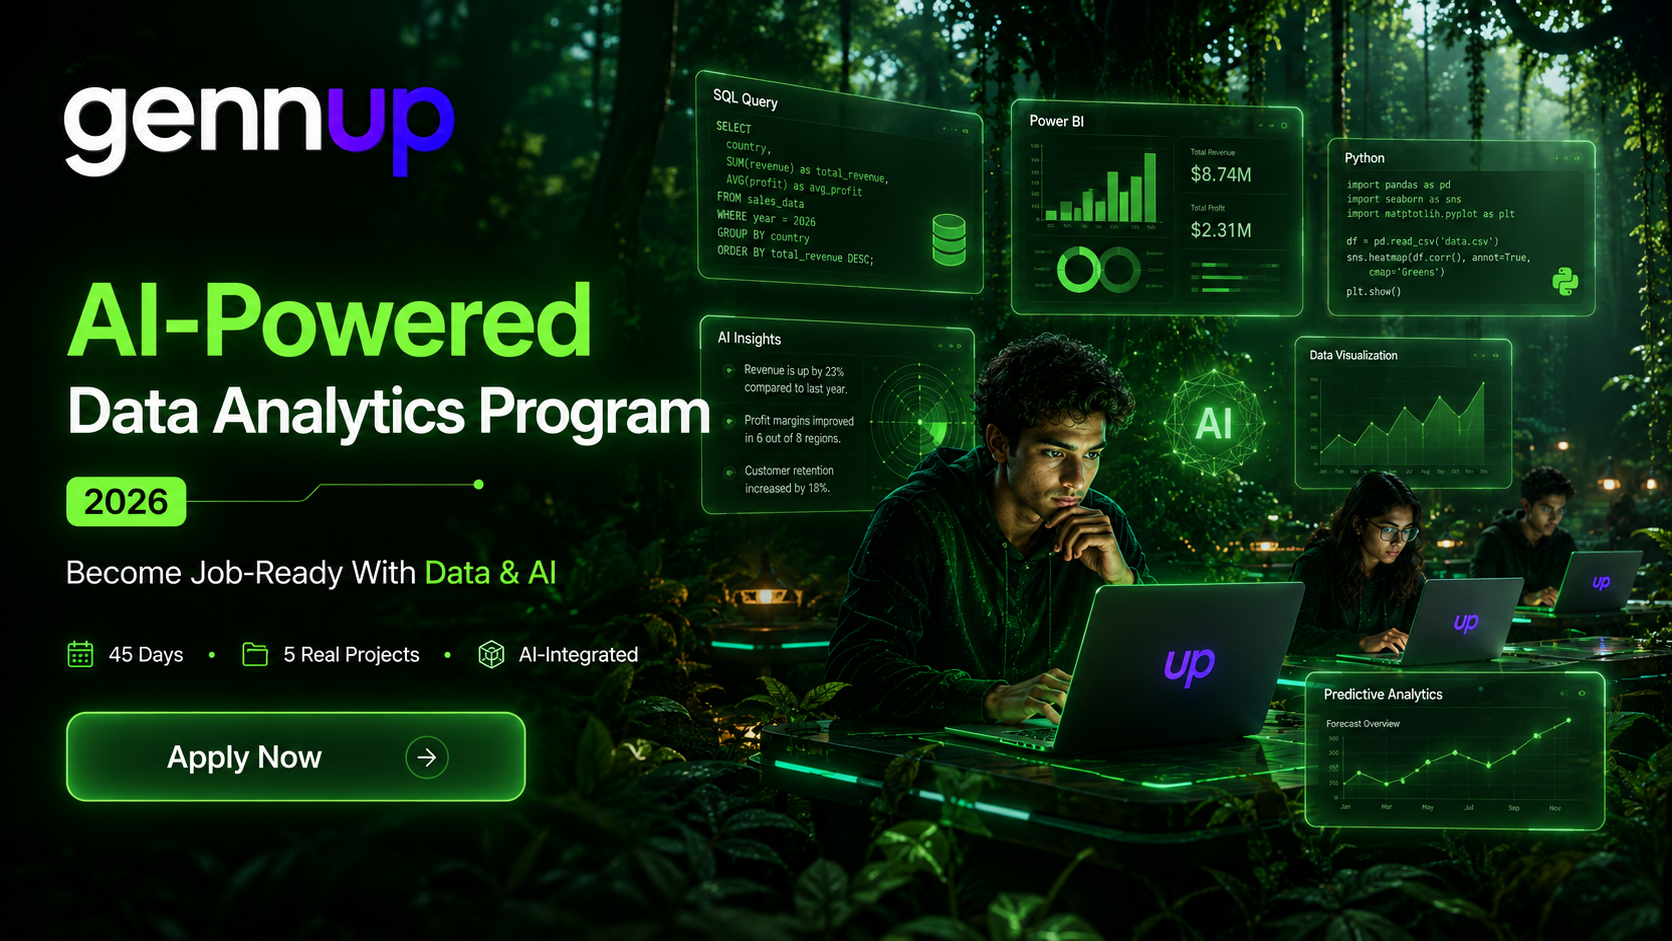
Become Job-Ready With
Data & AI.
Learn Excel, SQL, Power BI, Python, and AI-powered analytics through 5 real projects — designed to make you interview-ready and career-proof.
The Future Belongs To Students
Who Can Work With Data.
Every business today runs on data. Students who understand analytics, dashboards, and AI-powered decision-making will have a major edge in jobs, internships, and modern careers.
Data Is The New Literacy
Just as spreadsheets defined the last generation, SQL and analytics define this one. Every function — finance, marketing, operations, HR — now runs on dashboards and data decisions.
The Skills Gap Is Growing
Most students graduate without SQL or Power BI experience. Job descriptions demand both. The ones who have these skills get interviews; those who don't get filtered out before round one.
45 Days Changes Everything
The best time to build job-ready analytics skills is before you need them. Real projects, a full portfolio, and an AI-optimised resume — all before you sit in your first interview room.
Data Roles Are In Demand.
Most Students Aren't Ready.
Most courses teach tools in isolation. This program builds job-ready analysts — start to finish.
AI-Powered Data Analytics Program
A practical, AI-integrated analytics program designed to help students become industry-ready through projects, portfolio building, and real-world data workflows.
AI-Powered Excel Formulas
Use AI to generate complex Excel formulas instantly — no prior expertise required. Clean data, apply conditional logic, and build dynamic reports.
Pivot Tables & Dynamic Dashboards
Build sales and finance dashboards from scratch. Slicers, pivot charts, and interactive filters — the exact deliverables companies hire for.
Data Cleaning Techniques
VLOOKUP, INDEX-MATCH, text functions, date manipulation. Remove inconsistencies in messy real-world datasets before analysis begins.
Project — Sales Dashboard
End-to-end Excel project: raw data → cleaned data → pivot analysis → interactive dashboard. Portfolio-ready on Day 7.
SQL Foundations & Joins
SELECT, WHERE, GROUP BY, ORDER BY. INNER, LEFT, RIGHT, FULL joins. Build multi-table queries that produce real business insights.
Window Functions & CTEs
ROW_NUMBER, RANK, DENSE_RANK, LEAD, LAG. CTEs (WITH clause) and Subqueries — the concepts interviewers test that most self-taught users skip.
AI-Optimised Query Writing
Use AI to generate, explain, debug, and optimise SQL queries. Slash query-writing time while understanding every line produced.
Project — E-commerce Analytics
Music Store or E-commerce database: answer 15 real business questions using SQL. Shared publicly on LinkedIn as Project 2.
Power Query & Data Modelling
Connect, transform, and model data using Power Query. Star schema, relationships, and data type handling — the foundations most users get wrong.
DAX Measures vs Calculated Columns
The distinction most self-taught Power BI users get wrong. CALCULATE, SUMX, RANKX, time intelligence — the formulas that separate average from expert.
AI-Generated Power BI Insights
Use AI to auto-generate chart suggestions, measure explanations, and narrative summaries of your dashboard findings.
Project — Business Performance Dashboard
Multi-page Power BI report with KPI cards, trend analysis, and drill-throughs. The most impressive portfolio item most freshers will have.
Pandas & NumPy Foundations
DataFrames, series, filtering, groupby, merge. Handle missing values, outliers, and feature engineering — the actual analyst toolkit.
Matplotlib & Seaborn Visualisation
Bar charts, histograms, heatmaps, pairplots, box plots. Build publication-quality visualisations that tell a data story.
AI-Assisted Python Coding
Use AI to write, debug, and explain Python code. Speed up EDA by 70% while developing a genuine understanding of what the code does.
Project — Full EDA Report
End-to-end Exploratory Data Analysis on a real dataset — cleaning, analysis, visualisation, and written insights. Jupyter Notebook on GitHub.
End-to-End Data Workflow
Raw data → Excel cleaning → SQL analysis → Power BI dashboard → Python EDA → business story. The complete analyst pipeline in one integrated project.
Prompt Engineering for Analysts
Use AI at every workflow step — not as a separate skill, but as a professional analyst habit. Prompt Engineering woven into real data tasks.
Business Storytelling & KPI Analysis
Convert raw findings into executive summaries. KPI framing, variance analysis, and data narrative — what separates analysts from data entry clerks.
LinkedIn Capstone Post (Required)
Every student posts their capstone publicly on LinkedIn. Builds professional visibility, creates social proof, and signals seriousness to recruiters.
AI-Powered Resume Writing
AI writes a recruiter-optimised Data Analyst CV tailored to your projects and target roles. ATS-compatible format with quantified achievements.
LinkedIn Profile Optimisation
Headline, About section, skills, and featured projects — rebuilt to attract recruiters. AI roleplay gives honest feedback before you go live.
Mock HR & Technical Rounds
Structured HR Q&A and technical SQL/Python/Excel interview simulation with AI. Builds confidence and eliminates the most common failure points.
Interview Strategy & Job Search
Where to apply, how to approach recruiters, and what to say about your portfolio. A job-search system — not just skills — that gets callbacks.
- Data Cleaning & Wrangling
- Dashboard Design (Power BI)
- SQL Query Writing & Optimisation
- Exploratory Data Analysis
- AI-Assisted Analytics
- Resume & LinkedIn Optimisation
- Data Storytelling
- KPI Analysis & Reporting
What Students Actually
Walk Away With
Not just knowledge — real projects, a live portfolio, and a career infrastructure ready to deploy. Every outcome is measurable and immediately usable.
- A complete portfolio of 5 real projects spanning Excel, SQL, Power BI, and Python
- Full proficiency in the core Data Analyst tool stack required by modern job descriptions
- An AI-written, recruiter-optimised resume tailored for Data Analyst roles
- A LinkedIn profile designed to attract recruiters, hiring managers, and internship offers
- Advanced SQL skills including Window Functions, CTEs, and Subqueries — rare at fresher level
- End-to-end data workflow capability: raw data → SQL → visualisation → business story
- Preparation for both HR and Technical interview rounds with AI mock Q&A practice
- Prompt Engineering fluency applied to real analyst workflows — not as a standalone subject
Built For Students Who
Want To Be Hired.
This program is designed for a specific kind of student. See if that's you.
- You're a fresher or final-year student targeting Data Analyst roles
- You come from any background — commerce, arts, science, or engineering
- You want to build real projects before your first interview
- You've tried learning SQL or Python alone and got lost
- You want a full portfolio, a resume, and interview prep — not just skills
- You're a working professional looking to switch into data roles
- You want to use AI as a productivity multiplier, not replace fundamentals
- You want a certificate without doing all 5 portfolio projects
- You already have 2+ years of active data analytics experience
- You're not willing to complete Python and SQL assignments
- You're looking for a machine learning or data science program
- You expect AI to do the work without understanding what it produces
- You're not ready to post your capstone publicly on LinkedIn
- You want theory-heavy lectures without hands-on project work
What Students Are Saying
Real feedback from students who've been through the program.
I came from a commerce background and had never touched Python or SQL. By Week 3, I had built a real Power BI dashboard. The AI integration in every module made it click far faster than I expected.
The Advanced SQL module is no joke — CTEs and Window Functions are exactly what I was asked in my placement interview. I got the role. GennUp prepared me better than my entire 3-year degree did.
I have 5 projects on my LinkedIn and got 3 interview calls in the first week of posting. The capstone plus LinkedIn strategy from Module 6 alone is worth the entire program fee.
Learn Alongside
Ambitious Students.
GennUp is not passive learning. Students collaborate on real projects, solve business problems, share feedback, and grow inside a community focused on learning and modern careers.
Frequently Asked Questions
Everything you need to know before enrolling.
Zero prior experience is required. The program is designed so that AI handles the steepest learning curve in each tool — Excel formulas, SQL queries, and Python code are all assisted by AI. Commerce students, arts graduates, and engineering freshers all join on equal footing. The biggest barrier to entry is eliminated from Day 1.
Each module delivers one portfolio project: (1) Excel Sales or Finance Dashboard, (2) SQL E-commerce or Music Store Analytics Database, (3) Power BI Business Performance Dashboard, (4) Python Full Exploratory Data Analysis Report, and (5) Capstone End-to-End Business Case from raw data to insights. All five are shared on LinkedIn before Day 45 ends.
AI is woven into every module, not a separate subject. In Excel, AI generates formulas. In SQL, AI writes and optimises queries. In Power BI, AI auto-generates chart and measure suggestions. In Python, AI writes and explains code. In the Capstone, Prompt Engineering is practised as a professional analyst workflow. This is the 2025-upgraded version of a Data Analytics program.
Beyond the basics — SELECT, WHERE, GROUP BY, JOINs — the program covers Advanced SQL: Window Functions (ROW_NUMBER, RANK, DENSE_RANK, LEAD, LAG), CTEs (WITH clause), Subqueries, and query optimisation. These are exactly the concepts that separate average candidates from interview-passers. Their inclusion proves the curriculum is genuinely industry-benchmarked.
The program runs in both online and offline formats. Live instruction runs Monday to Friday with project-based sessions. Offline batches are based in Nagpur. Online students get the same live instruction experience with full access to all materials, recordings, project feedback, and the student community.
Module 6 — the final module — is entirely dedicated to career readiness: AI-powered resume writing, LinkedIn profile optimisation, mock HR rounds, mock Technical rounds, and full interview strategy. This level of built-in career support is rare in technical programs. You leave with a resume, a live LinkedIn profile, a posted capstone, and practised interview answers.
You'll need a laptop with a stable internet connection. Tools include Microsoft Excel (or Google Sheets), MySQL or PostgreSQL (free), Power BI Desktop (free), Python with Anaconda/Jupyter (free), and AI tools like ChatGPT and Claude (free tiers available). We guide you through every installation. No paid software is required to complete the program.
Graduates receive lifetime access to all program materials, a clear analytics career roadmap, access to the GennUp student community, and priority access to future advanced programs. You leave with a live portfolio, an optimised profile, and the complete infrastructure to start applying immediately. The program doesn't abandon you at the finish line.
You Enter As A Learner.
You Leave As A Data Analyst.
Build practical analytics skills, 5 real projects, and an AI-powered career infrastructure — before everyone else catches up.